
CRP: An Essential Tool for Manufacturers
Achieve Maximum Efficiency with Fluentis Production Resource Management
The CRP (Capacity Requirements Planning) module, integrated into Fluentis ERP, enables precise management of production resources. This means always having real-time insight into your actual production capacity and what’s required to meet customer demands while adhering to agreed delivery timelines.
With this tool, the Planning Department can quickly analyze and identify production overloads or inefficiencies. The module combines a planning and production Gantt chart with capacity histograms for individual work centers, making it easier to pinpoint and address issues effectively.
Modules and Features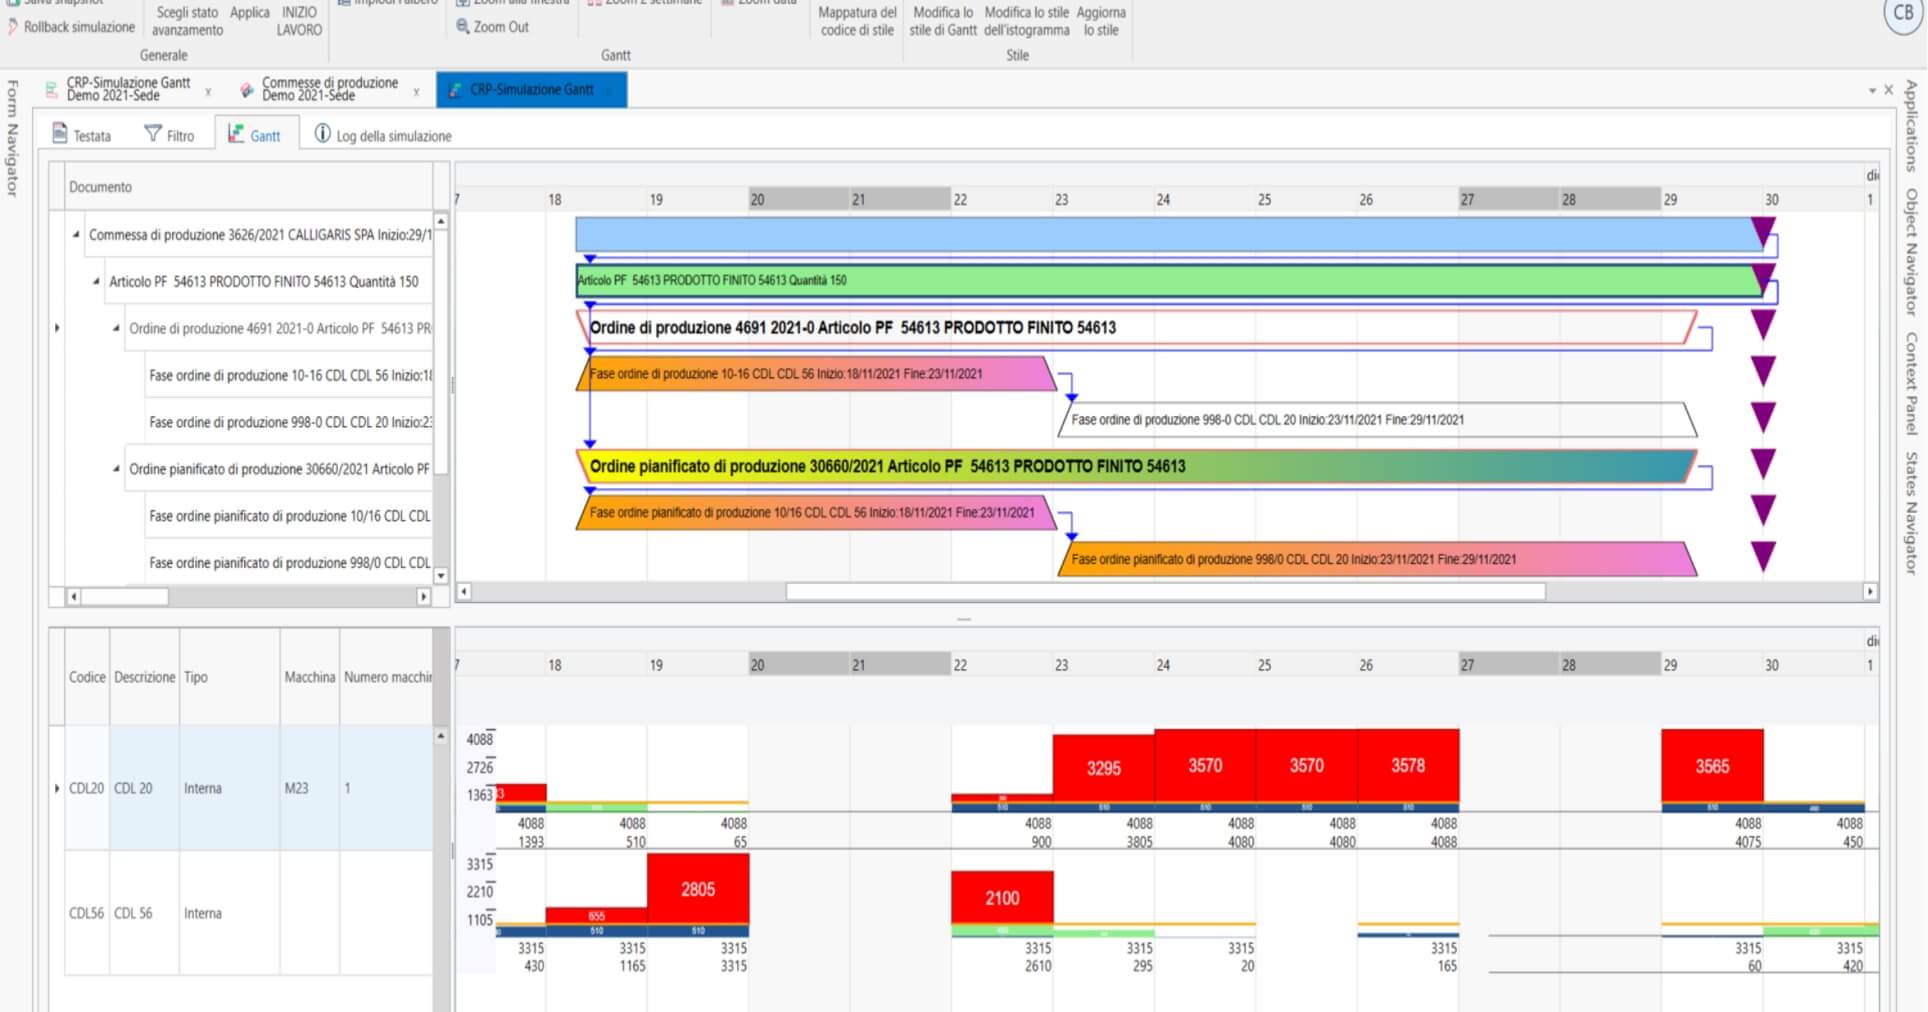
Strenghts
Simulate and Manage Work Center Loads: Optimize production organization without interfering with actual operations.
Gantt Chart: Visualize production job orders, both planned and active, down to individual production phase details.
Capacity Histograms: Instantly view workload levels for each active work center. Easily identify bottlenecks or inefficiencies.
Snapshots: Save simulation changes in the Gantt chart and revisit them later.
Control, Analyze,
Simulate

The Production Resource Management tool, or CRP (Capacity Requirements Planning), offers interactive features that enable work center load simulation and management without disrupting active production execution and planning.
With this tool, operators can:
- Select and group specific job orders.
- Analyze production loads within a defined timeframe or for individual work centers.
- Create “snapshots” to save simulations and evaluate optimal production setups.
- Utilize drag-and-drop functionality within the Gantt chart to reorganize job orders or individual phases.
Once satisfied with the simulation, operators can seamlessly implement the simulated plan into live operations.

Achieve the Highest Level of Detail
The load histogram allows you to drill down to the finest level of detail, from individual machines to specific personnel. This graphical representation displays the production department or work center workloads for a defined period, breaking down all phases impacting the analyzed timeframe.
With this tool, production overloads can be easily managed by rescheduling phases to different days or reallocating them to underutilized work centers. Before finalizing production, planners can evaluate various scenarios by using the Gantt chart, consolidating all workload elements for batches scheduled within a given period, simplifying production planning.
This simulation environment provides a comprehensive view of the job order structure, resource utilization, and the status of production phases, based on quantities produced. After optimizing production loads and resource allocation, simulations can be seamlessly transitioned into active production.

Simulate the Best Operational Scenario and Make It Real
With CRP, you can track the progress of any job order and evaluate multiple planning scenarios to assess their impact on work center capacity.
The Gantt chart visually positions the desired production job order over time, down to the details of each production phase and its progress.
This tool supports the management of multiple simulations without altering operational documents until a scenario is confirmed.
Using snapshots, planners can freeze changes made during Gantt simulations, saving the entire CRP environment in a separate workspace. They can revisit and refine these simulations later to finalize optimal setups.
Once completed, desired changes can be imported into the live production environment. At this stage, the system also identifies potential inconsistencies resulting from the updated production plan compared to initial conditions, ensuring a smooth transition to the operational phase.


What our customers say about Fluentis

La presenza in Fluentis ERP di tutti i moduli necessari senza dover ricorrere a software esterni reca molti vantaggi, i tempi di sviluppo sono sicuramente minori e anche le possibilità di errore si riducono
- Riccardo Ceredi, Titolare
LamieraPiù Srl
Functional Modules
Work Center Capacity
Operators can instantly view the workloads for each active work center within individual departments over a specified time frame. This provides immediate insight into potential overloads or inefficiencies in production.
With a simple drag & drop, operators can adjust schedules by moving operations earlier or later, or by reassigning them to different work centers. A double-click on any capacity bar reveals detailed information about the specific work orders occupying the work center on the selected date.
Features
- Workload visualization for individual work centers.
- Drag & drop functionality for quick and intuitive adjustments.
Gantt Chart
A key tool for production planning, the Gantt chart visually represents the timeline of a production job, down to the details of each production phase and its progress.
This tool allows you to manage multiple simulations without affecting the data in operational documents, until one is confirmed.
With snapshots, planners can freeze the changes made during Gantt simulations. The entire CRP environment can be saved in a separate context and revisited later to finalize the planning process. Once satisfied with the simulation, the desired changes can be imported into the live environment, where any discrepancies from the initial production plan can also be reviewed and addressed.
Features
- Graphical representation of a job’s total timeline and all associated activities.
- Display of resource utilization levels at specific dates.
- Drag & drop for intuitive and straightforward modifications.
- Snapshots for saving and managing simulations.
Phase Sequencing
This feature allows you to sequence production phases manually or based on operator-defined rules. It also highlights delayed phases with color-coded indicators, providing clear visibility into scheduling issues.
Features
- Adjust dates and work centers.
- Rearrange production phases.
- Switch between cycles or versions.
- Calculate sequence and start/end dates for production phases.
Discover how Fluentis ERP
can transform your business
15-day free trial | No automatic renewal | Instant access

Contact us for more information
Get in touch with us if you:
- Are a SMB in Manufacturing, Distribution, or Services
- Need to streamline and digitalize your business processes
- Want to take advantage of the benefits of a native cloud solution
- Want to replace your non-integrated softwares with a unified ERP platform
+1 281 404 1726
Chat with us